Motor Vehicle Accident Reconstruction & Biomechanical Physics – Part 2
Vehicle Data

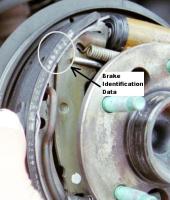
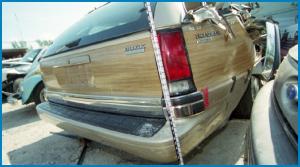
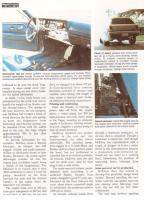
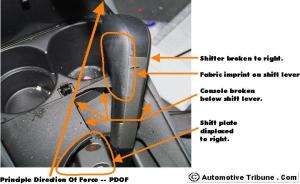
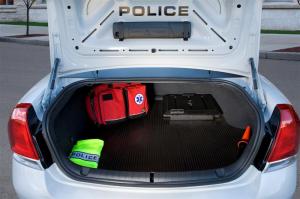
 Making a good physical inspeciton of a collision vehicle can provide much important information about impact severity and expected injuries. These example photographs document chest and facial impact. It is significant to note that the steering wheel is deformed more on the left side which indicates the relationship of Principle Direction Of Force or PDOF to the vehicle and the center of mass movent of the unrestrained driver.

 Close inspection for the inside of the windshield will often show evidence of hair and blood that can be recovered for further forensic analysis. Documentation of impact evidence is very important, especially when the investigator has to deal with the old statement “the dead person was driving“!
Human Data
 Medical personnel involved in an accident investigation can provide valuable injury information that assists in cause analysis. Where possible in fatality accidents, autopsies should be performed to determine the cause of death and record information about the injuries.
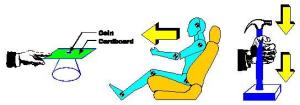
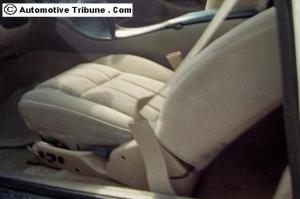
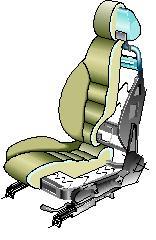
Nonfatal injury information is also useful to the investigator. Location of broken bones is especially useful when graphically represented in a skeleton diagram in a seated position, on left. Injury illustration could be done for each occupant to produce a composite occupant diagram for the vehicle. Injuries will indicate the direction of crash loading for the vehicle.Location of bruises and contusions can also be addressed, since these injuries can sometimes indicate use or nonuse of a seat belt or shoulder harness.
Head injuries are important clues. If an instrument panel, roof pillar, steering wheel or glass has evidence of a head strike (i.e., blood, skin, hair, dent, teeth), that spot should be documented. With a specific location for the strike and the relationship to the occupant’s body, the investigator can evaluate the angle of head impact, body position, and restraint system function, see below. It is important to remember that an occupants head motion is exactly opposite to the crash loading direction.
Deceleration Loads
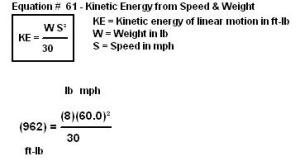
In a biomechanical investigation approach, the most important task is to determine occupant crash loads and probability of serious injury. Other investigative tasks help the biomechanical investigator to understand physical relationships in the accident which lead up to either receiving a serious injury or not. To calculate an average G force crash pulse, the following equation is used for each axis of occupant travel.
V 2
G avg = ____
2 g S
In this equation G = the average force on the specific occupant and is expressed as a multiple of occupant weight. Because of crash dynamics, peak G figures will typically be twice the average G.
V = velocity change at the major impact, expressed in ft/s
g = acceleration of gravity, 32.2 ft/s2
S = deceleration distance, expressed in ft
The biomechanical investigator should look for clues in each axis (i.e., roll, pitch, yaw) for velocity change and stopping or deceleration distance to be able to determine a unique crash loading for each occupant.
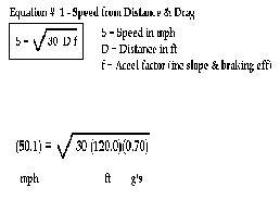
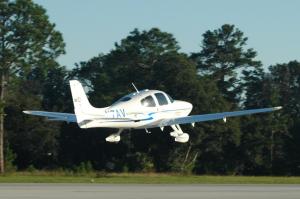
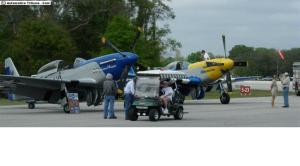
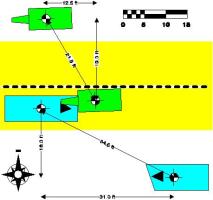
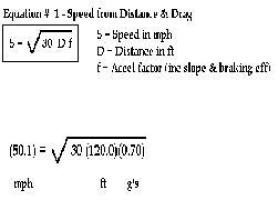
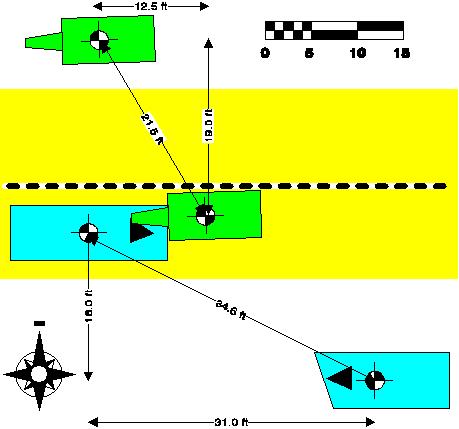
 An extreme example of how the different G loading is experienced by different people decelerating over different distances is found in this illustration. To understand the hypothetical mathematical concept, consider a long uniform airplane fuselage that crashes head-on into a cliff at 200 mph with Persons A, B, and C who decelerate in the crash distances of 5 ft, 20 ft, and 45 ft, respectively. A calculation of the average G-loading experience by Persons A, B, and C would be 266G, 66G, and 29G, respectively. The average G calculation for passenger C is:
![]() The average forward load on Persons A, B, and C can be calculated by multiplying each persons weight by each persons average G load. If the weights of Persons A, B, and C were 200 lb, 170 lb, and 100 lb, respectively, the average loading experienced would be 53,395 lbf, 11,346 lbf, and 2,966 lbf respectively. The weight load calculation for passenger C would be:
The average forward load on Persons A, B, and C can be calculated by multiplying each persons weight by each persons average G load. If the weights of Persons A, B, and C were 200 lb, 170 lb, and 100 lb, respectively, the average loading experienced would be 53,395 lbf, 11,346 lbf, and 2,966 lbf respectively. The weight load calculation for passenger C would be:
![]() This airplane example assumed seats and restraints that held throughout the crash sequence. For such a severe crash, it is not likely for all of the seats and restraints to remain attached. A seat will fail when its maximum load capability is exceeded. Assume seats with integral shoulder harness and lap belts were designed for 25G static loads in the forward direction. Person C of our airplane example would have a seat where the minimum force before seat separation can be expected of 25 times their weight of 170 lb x 25G or 4,250 lbf.
This airplane example assumed seats and restraints that held throughout the crash sequence. For such a severe crash, it is not likely for all of the seats and restraints to remain attached. A seat will fail when its maximum load capability is exceeded. Assume seats with integral shoulder harness and lap belts were designed for 25G static loads in the forward direction. Person C of our airplane example would have a seat where the minimum force before seat separation can be expected of 25 times their weight of 170 lb x 25G or 4,250 lbf.
The load experienced by Person C was 2,966 lbf average or 5,932 lbf peak. Thus, the seat for Person C would separate when its peak load exceeded the design load capability of the seat. The more damaging loads for Person C will occur later, when he or she undergoes major deceleration.
Automotive Loads
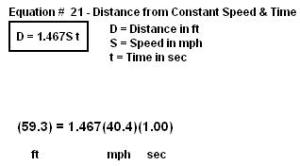
A vehicle traveling 35 mph sustained two feet of uniform crush. Substitution into the formula reveals the G forces for this accident.
VxV 35 x 35
G avg = ____ = __________ = 9.5 G avg x 2 = 19 G peak
2gS 2 x 32.2 x 2
 Federal Motor Vehicle Safety Standard, FMVSS 207 Seating Systems. Under this standard the seat must be capable of withstanding a force “20 times the weight of the seat applied in a forward (S4.2.a) or rearward (S4.2.b) longitudinal direction.” Thus if the seat weighs 30 lb then it must not fail at a level below 600 lb when calculated as 20 x 30 lb = 600 lb. It is important to note that occupant weight is not considered. S4.3.2.1 Static force specifies 20 times the weight of the seat back.
VERTICAL CRASH ANALYSIS
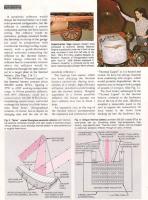
A more detailed analysis will reveal that the G loading will change throughout the crash sequence. For example, crash loads experienced by an occupant of an extremely high vertical velocity impact are shown on page 10. From point A to B, the crash loads are low (typically 2 to 3 G) as the landing gear deforms. Point B is where the fuselage lower skin contacts the terrain. Loading from point B to C to D to E is extremely high as the aircraft floor comes to rest at point F.
If an occupant is sitting on the floor, the loading experienced would have been points B to C to D to E to F. Note the horizontal line, which is an injury load threshold (within time duration limits) above which severe injury is expected. If the occupant is sitting on a seat, the vertical crash loading experienced will rise from point B to C and then drop to point G. Loads do not exceed point C, as this is the maximum strength of the seat which fails at Point C. The occupant’s load is about zero from point G to H because the occupant is basically free-falling from a seated position until contacting the floor at point H.
 However, the aircraft floor is just about to come to rest at point F. Thus, the occupant impacts a nearly stationary floor and the crash loads experienced by the occupant will go from point H to I to J. Unfortunately, occupant load penetration above the injury zone threshold line would indicate that a severe injury would be expected for the example occupant. It is obvious that an average G loading for an entire aircraft is inaccurate and misleading. Understanding the crash loads on an occupant is not possible without good information from the crash survival investigation on injuries, restraints, seat damage, and fuselage damage.